
Telekom MagentAI: An End-to-End Analytics Demo
Telekom MagentAI: An End-to-End Analytics Demo
Telekom MagentAI: An End-to-End Analytics Demo
Explore a working Microsoft Fabric demo and compare production-ready Fabric, Azure and hybrid architectures for AI-agent analytics.

The MagentAI Analytics Demo is an implemented end-to-end analytics solution built in Microsoft Fabric.
The solution demonstrates how operational service and AI-agent data can be ingested, processed through Bronze, Silver and Gold layers, modeled semantically and delivered through interactive Power BI reports.
The working implementation uses SharePoint as an accessible source system. This makes it possible to demonstrate the complete analytical lifecycle without requiring direct access to a production AI-agent platform.
Building on that implementation, this article presents four architectural variants:
The implemented Microsoft Fabric demo with SharePoint
A production-oriented end-to-end Microsoft Fabric architecture
A production-oriented end-to-end Azure architecture
A hybrid architecture combining Azure storage and integration with Microsoft Fabric analytics
Each variant solves the same fundamental business problem but differs in platform scope, operational responsibility, flexibility and implementation complexity.
This is a demonstration solution and does not represent a productive Telekom or T-Systems system.
The Business Scenario
The scenario represents an AI-supported customer-service environment serving users through channels such as web chat, mobile applications and service portals.
The platform produces operational data including:
Conversation logs
AI request and response logs
Handover events
Customer-satisfaction feedback
Knowledge-retrieval events
Service tickets
Network incidents
Telemetry and operational metrics
This information can support questions such as:
How many requests are processed by the AI agent?
How frequently are conversations handed over to employees?
Which channels and intents generate the highest workload?
Which services or regions produce the most incidents?
How satisfied are customers with AI-supported interactions?
How successfully does the agent retrieve relevant knowledge?
Where do operational bottlenecks or quality issues occur?
The objective is not merely to create a dashboard. It is to establish a governed analytical foundation that converts operational data into reliable and reusable business insights.
Variant 1: Implemented Fabric Demo with SharePoint
The first variant is the working solution shown in the project screenshots.
It demonstrates the complete analytics process within Microsoft Fabric, beginning with SharePoint source files and ending with an interactive Power BI report.
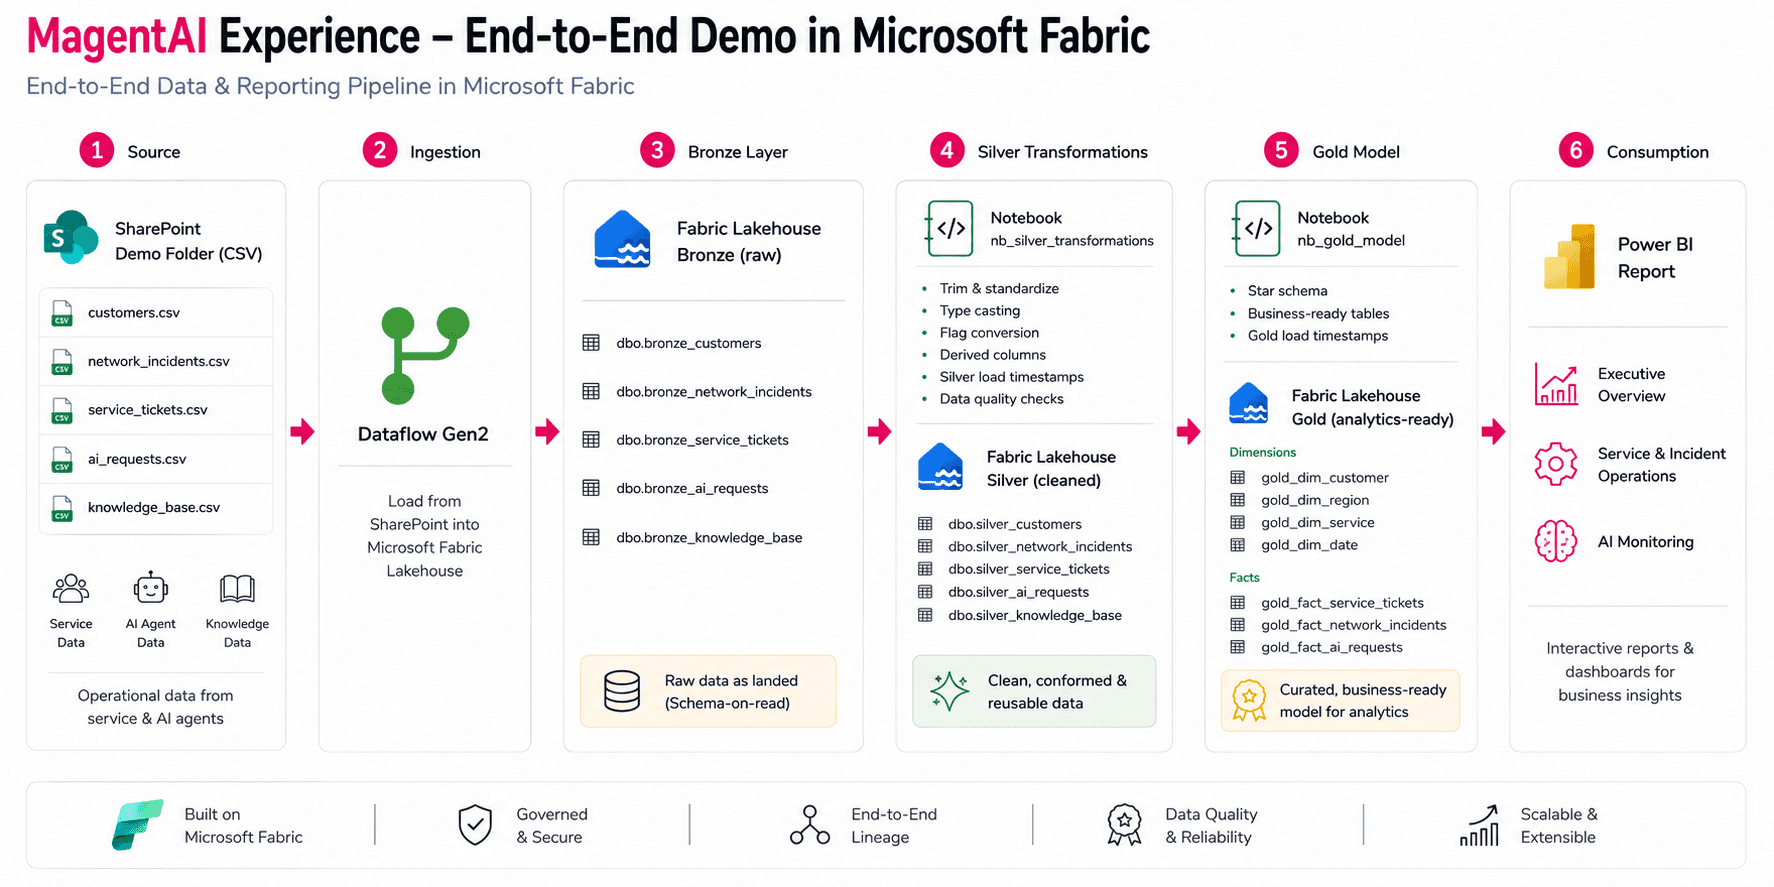
1. Source: SharePoint
The source data is stored as CSV files in a SharePoint folder.
The datasets include:
customers.csvnetwork_incidents.csvservice_tickets.csvai_requests.csvknowledge_base.csv
SharePoint provides a practical source for a reproducible demonstration. The source can be updated easily while the downstream architecture still follows principles applicable to a larger enterprise platform.
2. Ingestion with Dataflow Gen2
A Microsoft Fabric Dataflow Gen2 connects to SharePoint and loads the source files into a Fabric Lakehouse.
The Dataflow creates a clearly separated ingestion layer and prevents the source-system connection logic from being distributed across notebooks or reports.
The initial flow is:
SharePoint → Dataflow Gen2 → Fabric Bronze Lakehouse
3. Bronze Layer
The Bronze Lakehouse stores the source data close to its original structure.
Example tables include:
bronze_customersbronze_network_incidentsbronze_service_ticketsbronze_ai_requestsbronze_knowledge_base
The Bronze layer provides:
A traceable landing area
Preservation of source-level data
Support for reprocessing
Separation between ingestion and transformation
A basis for monitoring and lineage
The information is available centrally in Fabric, but it is not yet optimized for business reporting.
4. Silver Layer
A Fabric notebook cleans and standardizes the Bronze data.
The transformations include:
Trimming and standardizing text values
Converting data types
Normalizing dates and timestamps
Standardizing categories and status values
Deriving additional attributes
Adding technical load timestamps
Applying data-quality checks
The resulting Silver tables provide clean and reusable data structures.
Examples include:
silver_customerssilver_network_incidentssilver_service_ticketssilver_ai_requestssilver_knowledge_base
Centralizing this logic within the data platform avoids recreating transformations independently in different Power BI reports.
5. Gold Layer
A second notebook transforms the Silver data into business-ready dimensions and fact tables.
Example dimensions include:
Customer
Region
Service
Date
Example facts include:
Service tickets
Network incidents
AI requests
The Gold layer follows dimensional-modeling principles and creates a stable analytical interface for downstream consumption.
6. Power BI Consumption
A Power BI semantic model is built on the Gold data.
It contains:
Relationships
Measures
Business calculations
Key performance indicators
Security logic
Reusable reporting definitions
The report provides analytical perspectives such as:
Executive Overview
A management-level view of service performance, incidents, AI activity and major trends.
Service and Incident Operations
A detailed analysis of service tickets, priorities, affected regions, services and operational status.
AI Monitoring
A focused view of AI-request volume, usage patterns and the role of AI-supported interactions within the service environment.
The implemented end-to-end process is therefore:
SharePoint → Dataflow Gen2 → Bronze → Silver → Gold → Semantic Model → Power BI
Advantages
Fast to implement and easy to demonstrate
Uses a source system familiar to many organizations
Covers the complete Fabric analytics lifecycle
Clearly demonstrates the Medallion architecture
Requires relatively little supporting infrastructure
Suitable for workshops, prototypes and architecture discussions
Can later be extended or connected to productive sources
Limitations
SharePoint files are not representative of every production ingestion scenario
File-based sources offer limited support for low-latency processing
The implementation does not yet represent the complete operational complexity of an enterprise AI platform
Additional monitoring, deployment and recovery processes would be required for production use
Source-level security and lifecycle management remain relatively simple
Best Fit
This variant is particularly suitable for:
Proofs of concept
Technical demonstrations
Training
Workshops
Interviews
Early solution validation
Variant 2: Production-Oriented Microsoft Fabric Architecture
The second variant shows how the same solution could operate with a real AI-agent platform while using Microsoft Fabric as the central end-to-end analytics environment.
Instead of loading CSV files from SharePoint, Fabric receives operational data from APIs, event streams, databases, telemetry feeds or an Azure landing zone.
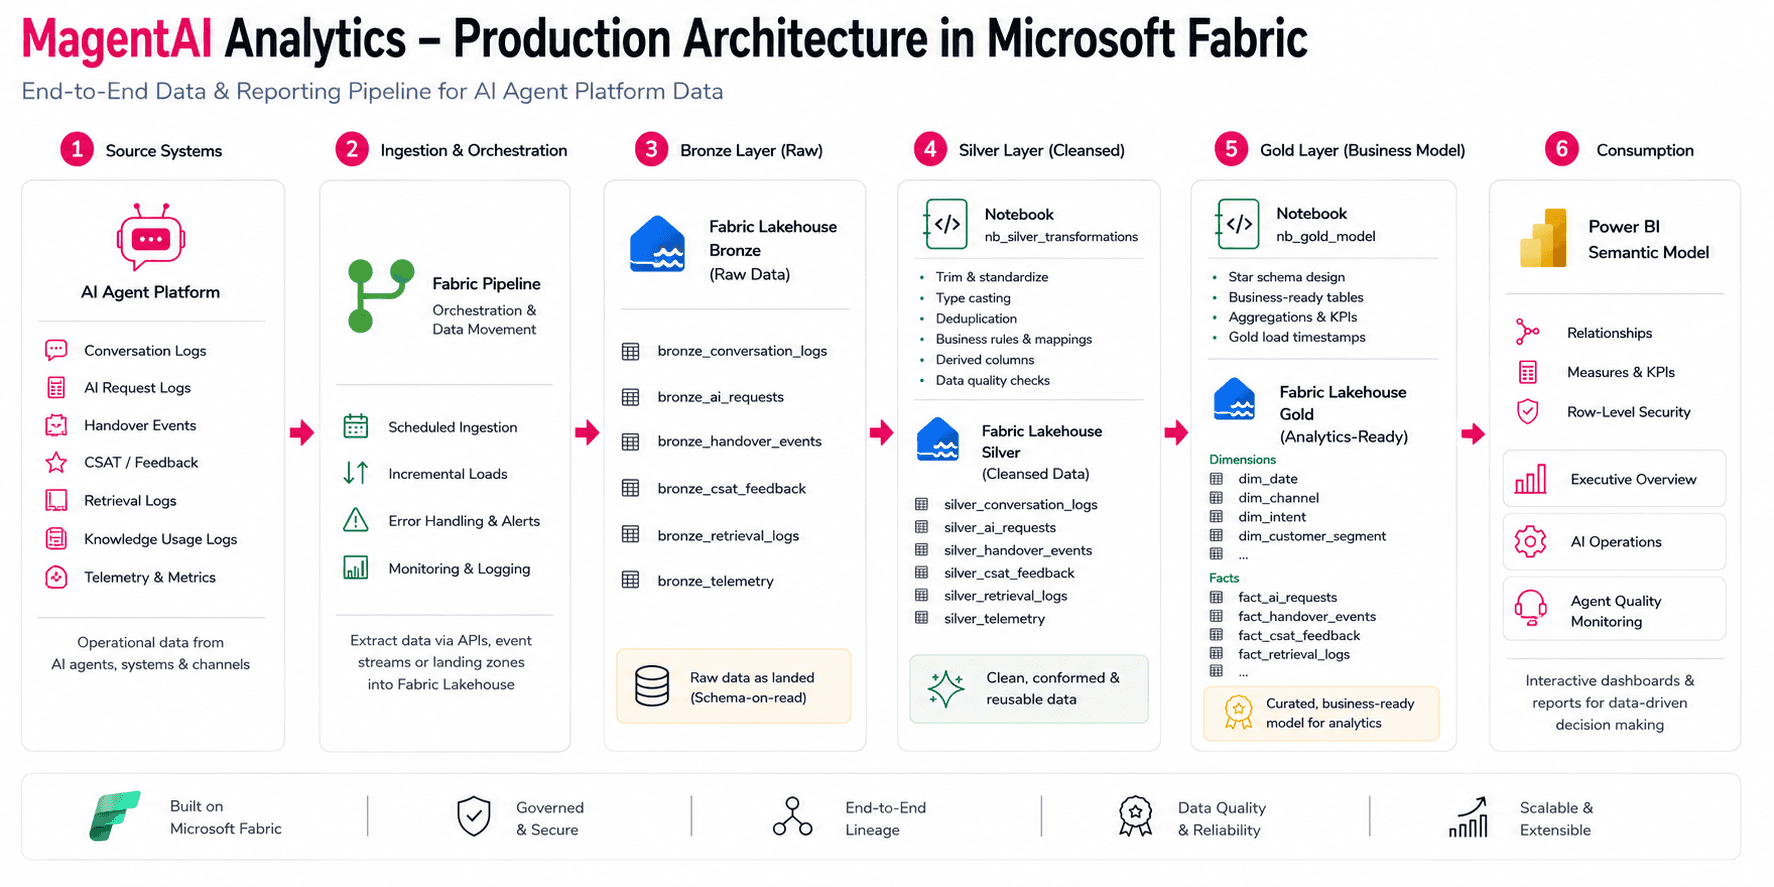
1. Operational Sources
The source environment can provide:
Conversation logs
AI requests
Handover events
Customer feedback
Retrieval logs
Knowledge-usage logs
Telemetry
Operational metrics
Data may be delivered through:
REST APIs
JSON or Parquet exports
Database interfaces
Event streams
Scheduled batches
Cloud storage
Operational landing zones
2. Fabric Ingestion and Orchestration
Fabric Pipelines orchestrate the movement of data into the Lakehouse.
A production pipeline can manage:
Scheduled ingestion
Incremental loading
Multiple source systems
Dependencies
Monitoring
Retry logic
Error handling
Alerts
Dataflow Gen2 can also be used where visual, Power Query-based transformation and connector support are appropriate.
3. Bronze Layer
The Bronze Lakehouse preserves raw operational data.
Typical tables include:
bronze_conversation_logsbronze_ai_requestsbronze_handover_eventsbronze_csat_feedbackbronze_retrieval_logsbronze_telemetry
This layer supports auditing, lineage and reprocessing while maintaining a close representation of the source.
4. Silver Layer
Fabric notebooks clean, standardize and enrich the raw information.
Typical processing includes:
Type conversion
Timestamp normalization
Deduplication
Intent standardization
Conversation enrichment
Handover classification
Data-quality validation
Business-rule implementation
Derived attributes and flags
The resulting data is conformed and reusable across analytical use cases.
5. Gold Layer
The Gold Lakehouse or Fabric Warehouse contains curated business entities.
Example dimensions:
Date
Channel
Intent
Customer segment
Example facts:
AI requests
Handovers
Customer satisfaction
Knowledge retrieval
The Gold model provides a governed interface between data engineering and business intelligence.
6. Consumption
Power BI consumes the Gold data through a semantic model containing relationships, measures, KPIs and row-level security.
Reports can include:
Executive Overview
AI Operations
Agent Quality Monitoring
Service and Incident Operations
Advantages
One integrated platform for ingestion, storage, engineering and reporting
Tight integration with Power BI
Shared governance and security model
Reduced integration effort between separate analytical services
OneLake provides a unified logical data foundation
Strong support for Lakehouse and Warehouse architectures
Easier collaboration across data engineering, analytics and BI teams
Faster implementation than assembling many independent services
Additional Fabric workloads can be introduced without creating a separate platform
Limitations
Creates a stronger strategic dependency on Microsoft Fabric
Capacity planning and workload management must be handled carefully
Existing Azure investments may be duplicated or underused
Highly specialized platform requirements may require Azure services outside Fabric
Some organizations may need more granular control over individual infrastructure components
Migration from an established Azure platform may require significant redesign
Best Fit
This variant is suitable when an organization:
Wants Fabric to become its central analytics platform
Uses Power BI as its primary reporting frontend
Prefers managed SaaS-style operations
Wants to reduce platform fragmentation
Is building a new analytical environment
Does not need to preserve a large existing Azure data architecture
Variant 3: Production-Oriented Azure Architecture
The third variant implements the same business scenario through dedicated Azure services.
It separates storage, orchestration, transformation, serving and reporting into independently operated components.

The principal services are:
Azure Data Lake Storage Gen2
Azure Data Factory
Azure Databricks
Azure SQL Database
Power BI
1. Source Systems
Operational data originates from the AI-agent platform and related service systems.
The source information can include:
Conversation and request logs
Customer feedback
Handover events
Retrieval and knowledge logs
Telemetry
Operational exports
2. Azure Landing Zone
Azure Data Lake Storage Gen2 acts as the central raw landing and historical storage area.
It can store:
JSON
Parquet
Log files
Structured exports
Historical snapshots
The landing zone preserves source data independently of the analytical processing layer.
3. Azure Data Factory
Azure Data Factory orchestrates ingestion and data movement.
Its responsibilities include:
Pipelines and workflows
Scheduled triggers
Dependency management
Copy activities
Monitoring
Error handling
Alerts
ADF loads data into the Data Lake and can also move prepared data between platform services.
4. Azure Databricks
Azure Databricks performs the Bronze, Silver and Gold transformations.
Bronze
Raw source data is preserved in a structured processing layer.
Silver
Data is:
Cleaned
Standardized
Validated
Deduplicated
Enriched
Gold
Business-ready facts, dimensions and aggregated structures are created.
Databricks provides flexible Spark-based engineering capabilities for large-scale and customized transformation workloads.
5. Azure SQL Serving Layer
The prepared dimensions and facts are written to Azure SQL Database.
Example tables include:
dim_datedim_channeldim_intentdim_customer_segmentfact_ai_requestsfact_handover_eventsfact_csat_feedbackfact_retrieval_logs
Azure SQL provides a stable relational serving layer for Power BI.
6. Power BI
Power BI connects to Azure SQL and adds the semantic and visualization layer.
It provides:
Relationships
Measures and KPIs
Business calculations
Row-level security
Interactive reports
The complete flow is:
AI Agent Platform → ADLS Gen2 → Azure Data Factory → Azure Databricks → Azure SQL → Power BI
Advantages
High level of control over each platform component
Independent scaling and configuration of services
Strong fit for established Azure and Databricks environments
Flexible implementation of complex engineering requirements
Mature support for custom networking and security patterns
Clear separation of operational responsibilities
Suitable for large or highly specialized data platforms
Existing Azure teams and investments can be reused
Limitations
More services must be integrated, monitored and maintained
Higher architectural and operational complexity
Governance can become fragmented across services
Separate cost models must be managed
Data may be copied between multiple storage and serving layers
Power BI remains outside the core transformation platform
More engineering effort is typically required to achieve an integrated user experience
New analytical capabilities may require additional Azure services and integrations
Best Fit
This architecture is suitable when an organization:
Already operates a mature Azure data platform
Has significant Azure Databricks investments
Requires detailed infrastructure control
Needs independent component scaling
Has specialized networking or security requirements
Uses Azure SQL as an established enterprise serving layer
Variant 4: Hybrid Azure and Microsoft Fabric Architecture
The fourth variant combines the strengths of Azure and Microsoft Fabric.
Azure remains responsible for source integration, ingestion and durable storage. Fabric becomes the analytical platform for transformation, dimensional modeling, semantic modeling and reporting.
This approach allows an organization to preserve its Azure investments while adopting Fabric incrementally.
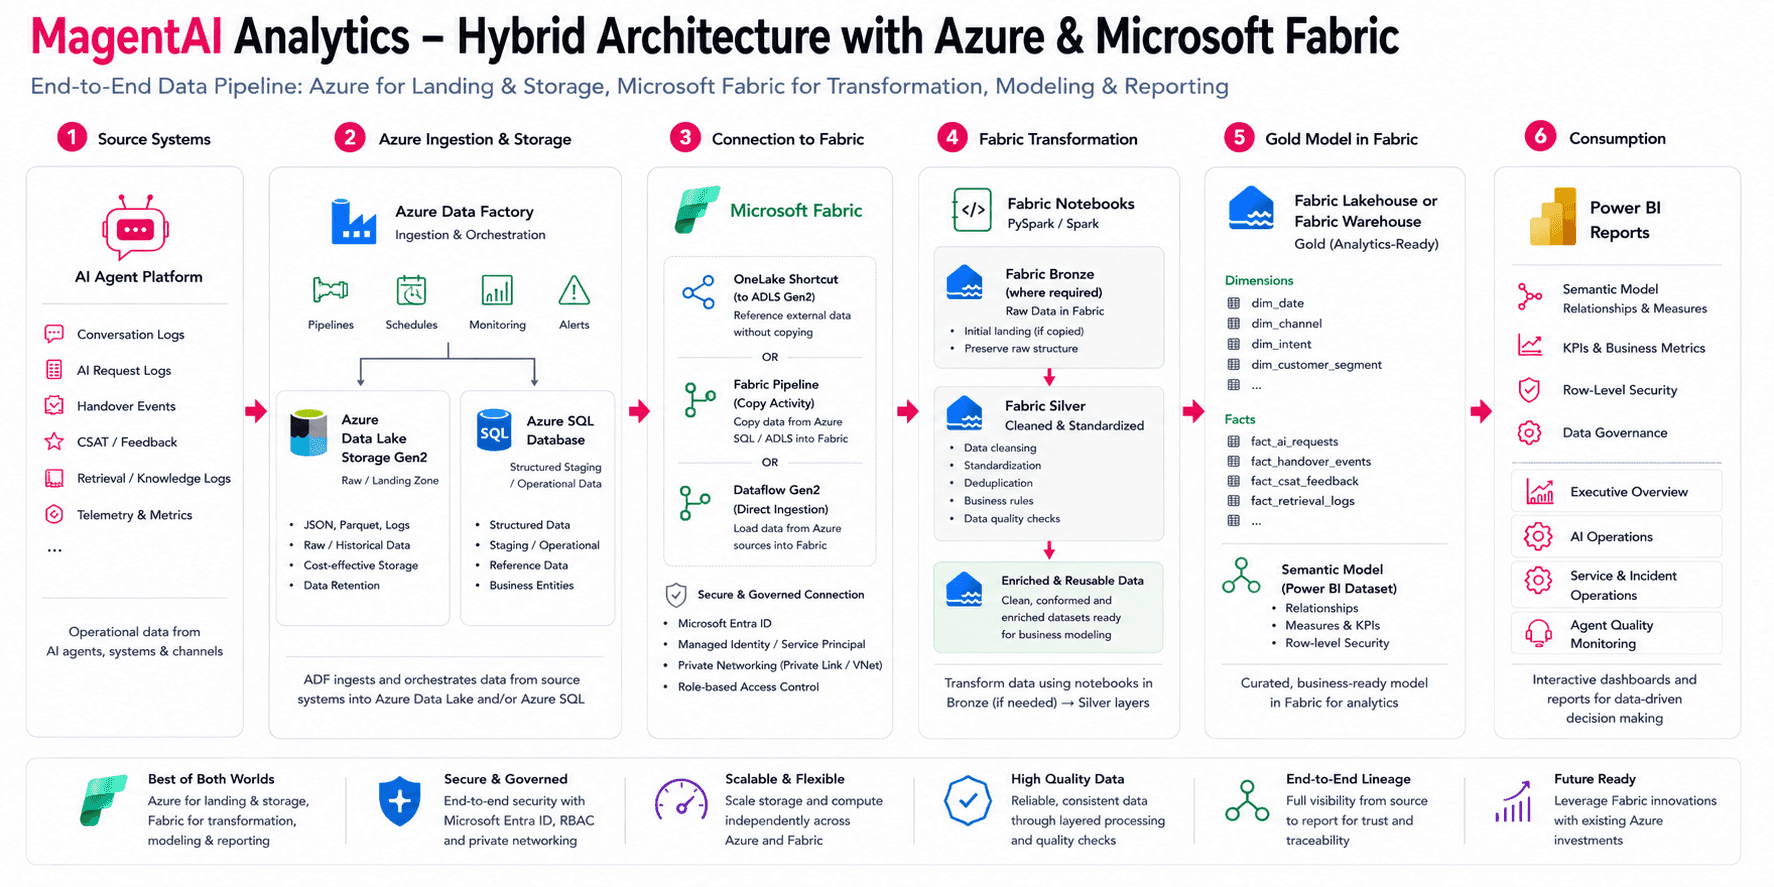
1. Source Systems
The hybrid solution begins with the same operational sources:
Conversation logs
AI request logs
Handover events
Customer feedback
Retrieval and knowledge logs
Telemetry
Operational databases
2. Azure Ingestion and Storage
Azure Data Factory sits at the beginning of the Azure processing flow.
It ingests and orchestrates data from source systems into one or both of the following storage destinations:
Azure Data Lake Storage Gen2
ADLS is used for:
Raw file storage
Historical retention
JSON, Parquet and log data
Scalable and cost-effective landing
Long-term source preservation
Azure SQL Database
Azure SQL can be used for:
Structured staging data
Operational tables
Reference data
Business entities
Relational source structures
ADLS and Azure SQL are complementary destinations. They are not necessarily sequential processing stages.
The logical Azure flow is:
Sources → Azure Data Factory → ADLS Gen2 and/or Azure SQL Database
3. Connection to Microsoft Fabric
Fabric can consume Azure data through several patterns.
OneLake Shortcut
An ADLS Gen2 shortcut can expose existing Azure data inside OneLake without requiring a complete physical copy.
This is especially useful when Azure already contains the authoritative raw and historical data.
Fabric Pipeline
A Fabric Pipeline can copy required information from ADLS or Azure SQL into a Fabric Lakehouse or Warehouse.
This approach is appropriate when Fabric requires:
An independent analytical copy
Controlled snapshots
Delta-based processing
Workload isolation
A Fabric-managed retention model
Dataflow Gen2
Dataflow Gen2 can connect to supported Azure sources and load structured data into Fabric through a visual Power Query experience.
Connection security can use:
Microsoft Entra ID
Workspace identity
Managed identity
Service principals
Role-based access control
Private networking where required
4. Fabric Transformation
The data is processed in Fabric through notebooks, Lakehouses or Warehouses.
Bronze Layer Where Required
A Fabric Bronze layer is useful when data is physically copied into Fabric.
It can:
Preserve the original Azure structure
Create controlled ingestion snapshots
Support independent reprocessing
Isolate analytics from operational storage
When Fabric accesses authoritative ADLS data through a shortcut, a second physical Bronze copy may not be required.
Silver Layer
Fabric notebooks clean and standardize the data through:
Type conversion
Deduplication
Business rules
Data-quality checks
Enrichment
Conformed structures
5. Gold Model in Fabric
A Fabric Lakehouse or Warehouse contains the business-ready Gold model.
Example dimensions:
Date
Channel
Intent
Customer segment
Example facts:
AI requests
Handovers
Customer satisfaction
Knowledge retrieval
The Gold layer provides a curated and reusable source for semantic modeling and advanced analytical workloads.
6. Consumption
Power BI provides the semantic and presentation layer.
The same consumption step includes:
Semantic model
Relationships
Measures and KPIs
Row-level security
Executive reports
AI Operations
Service and Incident Operations
Agent Quality Monitoring
The recommended hybrid flow is:
AI Agent Platform → Azure Data Factory → ADLS and/or Azure SQL → OneLake Shortcut, Fabric Pipeline or Dataflow Gen2 → Fabric Silver and Gold → Power BI
Advantages
Existing Azure ingestion and storage investments are preserved
Fabric can be introduced incrementally
Azure and Fabric responsibilities remain clearly separated
OneLake shortcuts can reduce unnecessary duplication for ADLS data
Azure retains authoritative raw and historical information
Fabric provides a unified analytical and semantic layer
Power BI integration is significantly tighter
The architecture supports gradual modernization
Azure and Fabric resources can be scaled independently
Teams can adopt Fabric without immediately replacing existing operational infrastructure
Limitations
Governance must be coordinated across Azure and Fabric
Security and lineage span platform boundaries
The responsibility split must be defined clearly
Data duplication can still occur when copy-based ingestion is chosen unnecessarily
Costs must be monitored across Azure services and Fabric capacity
Teams require knowledge of both platforms
Some scenarios may introduce additional latency between Azure ingestion and Fabric processing
Best Fit
The hybrid model is suitable when an organization:
Already uses Azure for enterprise data integration
Wants to retain ADLS or Azure SQL as authoritative storage
Wants to introduce Fabric without rebuilding the full platform
Uses Power BI strategically
Needs additional analytics, data science or real-time capabilities
Wants a controlled migration path toward a more unified analytics platform
Architecture Comparison
Variant 1: SharePoint Fabric Demo
Strongest benefit:
Fast, accessible and demonstrable end-to-end implementation.
Primary compromise:
The source and ingestion pattern are simplified compared with a productive AI platform.
Use when:
Demonstrating the concept, validating the design or training stakeholders.
Variant 2: Fabric End-to-End
Strongest benefit:
A unified platform covering ingestion, engineering, modeling and reporting.
Primary compromise:
Requires a strategic commitment to Fabric and may overlap with existing Azure investments.
Use when:
Building a new analytics platform or consolidating workloads around Fabric and Power BI.
Variant 3: Azure End-to-End
Strongest benefit:
Maximum flexibility and control over individual platform services.
Primary compromise:
Higher integration, governance and operational complexity.
Use when:
An established Azure platform, Databricks investment or specialized infrastructure requirement already exists.
Variant 4: Azure and Fabric Hybrid
Strongest benefit:
Preserves Azure foundations while introducing Fabric as a unified analytics and consumption platform.
Primary compromise:
Requires well-defined ownership and governance across two platform environments.
Use when:
Modernizing an existing Azure architecture while expanding analytical capabilities through Fabric.
Why the Hybrid Architecture Is Often the Ideal Target State
For many established organizations, the most pragmatic target architecture is the hybrid Azure and Fabric model.
A complete replacement of a functioning Azure platform is often unnecessary. Azure Data Factory, ADLS Gen2 and Azure SQL may already support numerous operational systems, security requirements and integration processes.
At the same time, keeping the complete analytics lifecycle exclusively in traditional Azure services can create a fragmented landscape. Storage, engineering, transformation, serving, semantic modeling and reporting may require separate services, security configurations and operating models.
The hybrid architecture allows both environments to perform the tasks for which they are best suited.
Azure as the Durable Foundation
Azure remains responsible for:
Enterprise source-system connectivity
Raw and historical storage
Operational staging
Established networking
Existing security integration
Reusable ingestion pipelines
Long-term retention
This protects previous investments and avoids unnecessary disruption.
Fabric as the Analytical Acceleration Layer
Fabric becomes responsible for:
Analytical transformation
Lakehouse and Warehouse modeling
Gold-layer creation
Semantic modeling
Power BI reporting
Data science
Real-time analytics
AI-assisted analysis
Conversational access to governed data
This extends the platform beyond conventional batch reporting.
Zero-Copy Access Where Appropriate
OneLake shortcuts can expose data stored in ADLS Gen2 to Fabric without requiring the entire dataset to be copied into OneLake.
This can:
Reduce duplicate storage
Shorten onboarding time
Lower data-movement overhead
Preserve Azure as the authoritative source
Make data available to Fabric analytical engines through a unified namespace
Physical copies should still be used where independent retention, transformation isolation, performance or regulatory requirements justify them.
Extended Analytical Capabilities
Once governed data is available in Fabric, the organization can extend the solution beyond traditional Power BI reporting.
Potential capabilities include:
Data Engineering
Fabric notebooks and Spark can support scalable transformation, enrichment and feature preparation.
Data Science
Data scientists can use Fabric notebooks and machine-learning workflows close to the governed analytical data.
Real-Time Intelligence
Streaming telemetry, events and operational signals can be ingested, analyzed and acted upon with reduced latency.
For the MagentAI scenario, this could support:
Live monitoring of AI requests
Immediate detection of handover spikes
Real-time service-quality alerts
Operational anomaly detection
Proactive incident escalation
AI Functions
Fabric AI functions can enrich structured datasets with language-model-powered processing.
Potential use cases include:
Classifying conversation topics
Extracting entities
Summarizing customer interactions
Detecting sentiment
Categorizing service requests
Enriching unstructured feedback
Fabric Data Agents
A Fabric data agent can provide conversational access to governed organizational data.
Instead of navigating a fixed dashboard, authorized users could ask questions such as:
Which service experienced the largest increase in AI handovers?
Which customer segments have the lowest satisfaction?
What were the primary reasons for failed retrievals this week?
Which regions show both high incident volume and low CSAT?
Copilot-Assisted Workflows
Copilot experiences can support data engineering, data exploration, DAX creation and report development.
These capabilities can reduce development friction and improve access to analytical insights, subject to licensing, governance and regional requirements.
Graph Analytics
Graph capabilities can help model and analyze complex relationships between:
Customers
Conversations
Services
Incidents
Knowledge articles
AI intents
Handover events
This may reveal patterns that are difficult to identify through conventional relational analysis alone.
Integrated Semantic Modeling and Power BI
Fabric also brings the analytical and reporting layers closer together.
The Gold model, semantic model and Power BI report can be governed within the same broader platform environment.
This improves:
Reuse of business logic
Consistency of KPIs
Collaboration between data engineers and BI developers
Lineage from source to report
Security management
Deployment and lifecycle management
A Gradual Modernization Path
The hybrid model does not require a big-bang migration.
An organization can begin with one domain or use case:
Keep the current Azure ingestion and storage processes.
Connect Fabric to selected Azure datasets.
Build the Silver and Gold layers in Fabric.
Introduce semantic models and Power BI reporting.
Add real-time, data science or AI workloads where they create value.
Review over time which existing Azure transformations should remain and which could move into Fabric.
This reduces implementation risk while creating a clear modernization path.
Recommended Architecture for MagentAI
For an established enterprise environment, the preferred target architecture would therefore be the hybrid Azure and Microsoft Fabric variant.
Azure would provide:
Stable source-system integration
Raw and historical storage
Enterprise networking
Operational staging
Existing security controls
Microsoft Fabric would provide:
Analytical transformation
Silver and Gold modeling
Semantic models
Power BI reporting
Real-Time Intelligence
Data Science
AI functions
Data agents
Additional future analytical experiences
The hybrid model creates a balance between:
Stability and innovation
Existing investment and modernization
Operational control and analytical agility
Durable storage and flexible consumption
It is therefore not simply a compromise between Azure and Fabric. In many environments, it is the architecture that makes the most effective use of both platforms.
Key Takeaways
Analytics Is an End-to-End Process
The value of analytics does not begin in Power BI. It begins with reliable source integration, controlled transformation and governed data modeling.
The Same Business Problem Supports Multiple Architectures
The MagentAI use case can be implemented through:
A practical Fabric demonstration
A complete Fabric platform
A modular Azure platform
A hybrid Azure and Fabric design
Medallion Architecture Creates Clear Responsibilities
Bronze, Silver and Gold layers separate:
Source preservation
Cleaning and standardization
Business modeling
The Semantic Layer Remains Essential
Power BI semantic models centralize:
Relationships
Measures
KPIs
Security
Reusable business definitions
Hybrid Does Not Mean Unnecessarily Duplicating Data
Shortcuts, pipelines and Dataflows should be selected deliberately.
Not every Azure dataset requires another physical Bronze copy in Fabric.
Fabric Extends the Solution Beyond Reporting
Fabric can add:
Data engineering
Real-time analytics
Data science
AI enrichment
Conversational data access
Graph-based analysis
Integrated semantic modeling
Conclusion
The implemented SharePoint-based Fabric demo proves the complete analytical concept: source integration, ingestion, layered transformation, dimensional modeling, semantic modeling and Power BI reporting.
The additional production variants demonstrate how the same concept can evolve according to an organization’s platform strategy.
A Fabric-only architecture provides the most unified experience.
An Azure-only architecture provides extensive control and modularity.
A hybrid architecture preserves Azure as the durable integration and storage foundation while using Fabric to expand the analytical, semantic, real-time and AI capabilities of the solution.
For an organization with existing Azure investments and a strategic focus on Power BI, this hybrid model is often the strongest long-term approach:
Azure provides the enterprise data foundation. Microsoft Fabric turns that foundation into governed, scalable and AI-ready business value.
The MagentAI Analytics Demo is an implemented end-to-end analytics solution built in Microsoft Fabric.
The solution demonstrates how operational service and AI-agent data can be ingested, processed through Bronze, Silver and Gold layers, modeled semantically and delivered through interactive Power BI reports.
The working implementation uses SharePoint as an accessible source system. This makes it possible to demonstrate the complete analytical lifecycle without requiring direct access to a production AI-agent platform.
Building on that implementation, this article presents four architectural variants:
The implemented Microsoft Fabric demo with SharePoint
A production-oriented end-to-end Microsoft Fabric architecture
A production-oriented end-to-end Azure architecture
A hybrid architecture combining Azure storage and integration with Microsoft Fabric analytics
Each variant solves the same fundamental business problem but differs in platform scope, operational responsibility, flexibility and implementation complexity.
This is a demonstration solution and does not represent a productive Telekom or T-Systems system.
The Business Scenario
The scenario represents an AI-supported customer-service environment serving users through channels such as web chat, mobile applications and service portals.
The platform produces operational data including:
Conversation logs
AI request and response logs
Handover events
Customer-satisfaction feedback
Knowledge-retrieval events
Service tickets
Network incidents
Telemetry and operational metrics
This information can support questions such as:
How many requests are processed by the AI agent?
How frequently are conversations handed over to employees?
Which channels and intents generate the highest workload?
Which services or regions produce the most incidents?
How satisfied are customers with AI-supported interactions?
How successfully does the agent retrieve relevant knowledge?
Where do operational bottlenecks or quality issues occur?
The objective is not merely to create a dashboard. It is to establish a governed analytical foundation that converts operational data into reliable and reusable business insights.
Variant 1: Implemented Fabric Demo with SharePoint
The first variant is the working solution shown in the project screenshots.
It demonstrates the complete analytics process within Microsoft Fabric, beginning with SharePoint source files and ending with an interactive Power BI report.
1. Source: SharePoint
The source data is stored as CSV files in a SharePoint folder.
The datasets include:
customers.csvnetwork_incidents.csvservice_tickets.csvai_requests.csvknowledge_base.csv
SharePoint provides a practical source for a reproducible demonstration. The source can be updated easily while the downstream architecture still follows principles applicable to a larger enterprise platform.
2. Ingestion with Dataflow Gen2
A Microsoft Fabric Dataflow Gen2 connects to SharePoint and loads the source files into a Fabric Lakehouse.
The Dataflow creates a clearly separated ingestion layer and prevents the source-system connection logic from being distributed across notebooks or reports.
The initial flow is:
SharePoint → Dataflow Gen2 → Fabric Bronze Lakehouse
3. Bronze Layer
The Bronze Lakehouse stores the source data close to its original structure.
Example tables include:
bronze_customersbronze_network_incidentsbronze_service_ticketsbronze_ai_requestsbronze_knowledge_base
The Bronze layer provides:
A traceable landing area
Preservation of source-level data
Support for reprocessing
Separation between ingestion and transformation
A basis for monitoring and lineage
The information is available centrally in Fabric, but it is not yet optimized for business reporting.
4. Silver Layer
A Fabric notebook cleans and standardizes the Bronze data.
The transformations include:
Trimming and standardizing text values
Converting data types
Normalizing dates and timestamps
Standardizing categories and status values
Deriving additional attributes
Adding technical load timestamps
Applying data-quality checks
The resulting Silver tables provide clean and reusable data structures.
Examples include:
silver_customerssilver_network_incidentssilver_service_ticketssilver_ai_requestssilver_knowledge_base
Centralizing this logic within the data platform avoids recreating transformations independently in different Power BI reports.
5. Gold Layer
A second notebook transforms the Silver data into business-ready dimensions and fact tables.
Example dimensions include:
Customer
Region
Service
Date
Example facts include:
Service tickets
Network incidents
AI requests
The Gold layer follows dimensional-modeling principles and creates a stable analytical interface for downstream consumption.
6. Power BI Consumption
A Power BI semantic model is built on the Gold data.
It contains:
Relationships
Measures
Business calculations
Key performance indicators
Security logic
Reusable reporting definitions
The report provides analytical perspectives such as:
Executive Overview
A management-level view of service performance, incidents, AI activity and major trends.
Service and Incident Operations
A detailed analysis of service tickets, priorities, affected regions, services and operational status.
AI Monitoring
A focused view of AI-request volume, usage patterns and the role of AI-supported interactions within the service environment.
The implemented end-to-end process is therefore:
SharePoint → Dataflow Gen2 → Bronze → Silver → Gold → Semantic Model → Power BI
Advantages
Fast to implement and easy to demonstrate
Uses a source system familiar to many organizations
Covers the complete Fabric analytics lifecycle
Clearly demonstrates the Medallion architecture
Requires relatively little supporting infrastructure
Suitable for workshops, prototypes and architecture discussions
Can later be extended or connected to productive sources
Limitations
SharePoint files are not representative of every production ingestion scenario
File-based sources offer limited support for low-latency processing
The implementation does not yet represent the complete operational complexity of an enterprise AI platform
Additional monitoring, deployment and recovery processes would be required for production use
Source-level security and lifecycle management remain relatively simple
Best Fit
This variant is particularly suitable for:
Proofs of concept
Technical demonstrations
Training
Workshops
Interviews
Early solution validation
Variant 2: Production-Oriented Microsoft Fabric Architecture
The second variant shows how the same solution could operate with a real AI-agent platform while using Microsoft Fabric as the central end-to-end analytics environment.
Instead of loading CSV files from SharePoint, Fabric receives operational data from APIs, event streams, databases, telemetry feeds or an Azure landing zone.
1. Operational Sources
The source environment can provide:
Conversation logs
AI requests
Handover events
Customer feedback
Retrieval logs
Knowledge-usage logs
Telemetry
Operational metrics
Data may be delivered through:
REST APIs
JSON or Parquet exports
Database interfaces
Event streams
Scheduled batches
Cloud storage
Operational landing zones
2. Fabric Ingestion and Orchestration
Fabric Pipelines orchestrate the movement of data into the Lakehouse.
A production pipeline can manage:
Scheduled ingestion
Incremental loading
Multiple source systems
Dependencies
Monitoring
Retry logic
Error handling
Alerts
Dataflow Gen2 can also be used where visual, Power Query-based transformation and connector support are appropriate.
3. Bronze Layer
The Bronze Lakehouse preserves raw operational data.
Typical tables include:
bronze_conversation_logsbronze_ai_requestsbronze_handover_eventsbronze_csat_feedbackbronze_retrieval_logsbronze_telemetry
This layer supports auditing, lineage and reprocessing while maintaining a close representation of the source.
4. Silver Layer
Fabric notebooks clean, standardize and enrich the raw information.
Typical processing includes:
Type conversion
Timestamp normalization
Deduplication
Intent standardization
Conversation enrichment
Handover classification
Data-quality validation
Business-rule implementation
Derived attributes and flags
The resulting data is conformed and reusable across analytical use cases.
5. Gold Layer
The Gold Lakehouse or Fabric Warehouse contains curated business entities.
Example dimensions:
Date
Channel
Intent
Customer segment
Example facts:
AI requests
Handovers
Customer satisfaction
Knowledge retrieval
The Gold model provides a governed interface between data engineering and business intelligence.
6. Consumption
Power BI consumes the Gold data through a semantic model containing relationships, measures, KPIs and row-level security.
Reports can include:
Executive Overview
AI Operations
Agent Quality Monitoring
Service and Incident Operations
Advantages
One integrated platform for ingestion, storage, engineering and reporting
Tight integration with Power BI
Shared governance and security model
Reduced integration effort between separate analytical services
OneLake provides a unified logical data foundation
Strong support for Lakehouse and Warehouse architectures
Easier collaboration across data engineering, analytics and BI teams
Faster implementation than assembling many independent services
Additional Fabric workloads can be introduced without creating a separate platform
Limitations
Creates a stronger strategic dependency on Microsoft Fabric
Capacity planning and workload management must be handled carefully
Existing Azure investments may be duplicated or underused
Highly specialized platform requirements may require Azure services outside Fabric
Some organizations may need more granular control over individual infrastructure components
Migration from an established Azure platform may require significant redesign
Best Fit
This variant is suitable when an organization:
Wants Fabric to become its central analytics platform
Uses Power BI as its primary reporting frontend
Prefers managed SaaS-style operations
Wants to reduce platform fragmentation
Is building a new analytical environment
Does not need to preserve a large existing Azure data architecture
Variant 3: Production-Oriented Azure Architecture
The third variant implements the same business scenario through dedicated Azure services.
It separates storage, orchestration, transformation, serving and reporting into independently operated components.
The principal services are:
Azure Data Lake Storage Gen2
Azure Data Factory
Azure Databricks
Azure SQL Database
Power BI
1. Source Systems
Operational data originates from the AI-agent platform and related service systems.
The source information can include:
Conversation and request logs
Customer feedback
Handover events
Retrieval and knowledge logs
Telemetry
Operational exports
2. Azure Landing Zone
Azure Data Lake Storage Gen2 acts as the central raw landing and historical storage area.
It can store:
JSON
Parquet
Log files
Structured exports
Historical snapshots
The landing zone preserves source data independently of the analytical processing layer.
3. Azure Data Factory
Azure Data Factory orchestrates ingestion and data movement.
Its responsibilities include:
Pipelines and workflows
Scheduled triggers
Dependency management
Copy activities
Monitoring
Error handling
Alerts
ADF loads data into the Data Lake and can also move prepared data between platform services.
4. Azure Databricks
Azure Databricks performs the Bronze, Silver and Gold transformations.
Bronze
Raw source data is preserved in a structured processing layer.
Silver
Data is:
Cleaned
Standardized
Validated
Deduplicated
Enriched
Gold
Business-ready facts, dimensions and aggregated structures are created.
Databricks provides flexible Spark-based engineering capabilities for large-scale and customized transformation workloads.
5. Azure SQL Serving Layer
The prepared dimensions and facts are written to Azure SQL Database.
Example tables include:
dim_datedim_channeldim_intentdim_customer_segmentfact_ai_requestsfact_handover_eventsfact_csat_feedbackfact_retrieval_logs
Azure SQL provides a stable relational serving layer for Power BI.
6. Power BI
Power BI connects to Azure SQL and adds the semantic and visualization layer.
It provides:
Relationships
Measures and KPIs
Business calculations
Row-level security
Interactive reports
The complete flow is:
AI Agent Platform → ADLS Gen2 → Azure Data Factory → Azure Databricks → Azure SQL → Power BI
Advantages
High level of control over each platform component
Independent scaling and configuration of services
Strong fit for established Azure and Databricks environments
Flexible implementation of complex engineering requirements
Mature support for custom networking and security patterns
Clear separation of operational responsibilities
Suitable for large or highly specialized data platforms
Existing Azure teams and investments can be reused
Limitations
More services must be integrated, monitored and maintained
Higher architectural and operational complexity
Governance can become fragmented across services
Separate cost models must be managed
Data may be copied between multiple storage and serving layers
Power BI remains outside the core transformation platform
More engineering effort is typically required to achieve an integrated user experience
New analytical capabilities may require additional Azure services and integrations
Best Fit
This architecture is suitable when an organization:
Already operates a mature Azure data platform
Has significant Azure Databricks investments
Requires detailed infrastructure control
Needs independent component scaling
Has specialized networking or security requirements
Uses Azure SQL as an established enterprise serving layer
Variant 4: Hybrid Azure and Microsoft Fabric Architecture
The fourth variant combines the strengths of Azure and Microsoft Fabric.
Azure remains responsible for source integration, ingestion and durable storage. Fabric becomes the analytical platform for transformation, dimensional modeling, semantic modeling and reporting.
This approach allows an organization to preserve its Azure investments while adopting Fabric incrementally.
1. Source Systems
The hybrid solution begins with the same operational sources:
Conversation logs
AI request logs
Handover events
Customer feedback
Retrieval and knowledge logs
Telemetry
Operational databases
2. Azure Ingestion and Storage
Azure Data Factory sits at the beginning of the Azure processing flow.
It ingests and orchestrates data from source systems into one or both of the following storage destinations:
Azure Data Lake Storage Gen2
ADLS is used for:
Raw file storage
Historical retention
JSON, Parquet and log data
Scalable and cost-effective landing
Long-term source preservation
Azure SQL Database
Azure SQL can be used for:
Structured staging data
Operational tables
Reference data
Business entities
Relational source structures
ADLS and Azure SQL are complementary destinations. They are not necessarily sequential processing stages.
The logical Azure flow is:
Sources → Azure Data Factory → ADLS Gen2 and/or Azure SQL Database
3. Connection to Microsoft Fabric
Fabric can consume Azure data through several patterns.
OneLake Shortcut
An ADLS Gen2 shortcut can expose existing Azure data inside OneLake without requiring a complete physical copy.
This is especially useful when Azure already contains the authoritative raw and historical data.
Fabric Pipeline
A Fabric Pipeline can copy required information from ADLS or Azure SQL into a Fabric Lakehouse or Warehouse.
This approach is appropriate when Fabric requires:
An independent analytical copy
Controlled snapshots
Delta-based processing
Workload isolation
A Fabric-managed retention model
Dataflow Gen2
Dataflow Gen2 can connect to supported Azure sources and load structured data into Fabric through a visual Power Query experience.
Connection security can use:
Microsoft Entra ID
Workspace identity
Managed identity
Service principals
Role-based access control
Private networking where required
4. Fabric Transformation
The data is processed in Fabric through notebooks, Lakehouses or Warehouses.
Bronze Layer Where Required
A Fabric Bronze layer is useful when data is physically copied into Fabric.
It can:
Preserve the original Azure structure
Create controlled ingestion snapshots
Support independent reprocessing
Isolate analytics from operational storage
When Fabric accesses authoritative ADLS data through a shortcut, a second physical Bronze copy may not be required.
Silver Layer
Fabric notebooks clean and standardize the data through:
Type conversion
Deduplication
Business rules
Data-quality checks
Enrichment
Conformed structures
5. Gold Model in Fabric
A Fabric Lakehouse or Warehouse contains the business-ready Gold model.
Example dimensions:
Date
Channel
Intent
Customer segment
Example facts:
AI requests
Handovers
Customer satisfaction
Knowledge retrieval
The Gold layer provides a curated and reusable source for semantic modeling and advanced analytical workloads.
6. Consumption
Power BI provides the semantic and presentation layer.
The same consumption step includes:
Semantic model
Relationships
Measures and KPIs
Row-level security
Executive reports
AI Operations
Service and Incident Operations
Agent Quality Monitoring
The recommended hybrid flow is:
AI Agent Platform → Azure Data Factory → ADLS and/or Azure SQL → OneLake Shortcut, Fabric Pipeline or Dataflow Gen2 → Fabric Silver and Gold → Power BI
Advantages
Existing Azure ingestion and storage investments are preserved
Fabric can be introduced incrementally
Azure and Fabric responsibilities remain clearly separated
OneLake shortcuts can reduce unnecessary duplication for ADLS data
Azure retains authoritative raw and historical information
Fabric provides a unified analytical and semantic layer
Power BI integration is significantly tighter
The architecture supports gradual modernization
Azure and Fabric resources can be scaled independently
Teams can adopt Fabric without immediately replacing existing operational infrastructure
Limitations
Governance must be coordinated across Azure and Fabric
Security and lineage span platform boundaries
The responsibility split must be defined clearly
Data duplication can still occur when copy-based ingestion is chosen unnecessarily
Costs must be monitored across Azure services and Fabric capacity
Teams require knowledge of both platforms
Some scenarios may introduce additional latency between Azure ingestion and Fabric processing
Best Fit
The hybrid model is suitable when an organization:
Already uses Azure for enterprise data integration
Wants to retain ADLS or Azure SQL as authoritative storage
Wants to introduce Fabric without rebuilding the full platform
Uses Power BI strategically
Needs additional analytics, data science or real-time capabilities
Wants a controlled migration path toward a more unified analytics platform
Architecture Comparison
Variant 1: SharePoint Fabric Demo
Strongest benefit:
Fast, accessible and demonstrable end-to-end implementation.
Primary compromise:
The source and ingestion pattern are simplified compared with a productive AI platform.
Use when:
Demonstrating the concept, validating the design or training stakeholders.
Variant 2: Fabric End-to-End
Strongest benefit:
A unified platform covering ingestion, engineering, modeling and reporting.
Primary compromise:
Requires a strategic commitment to Fabric and may overlap with existing Azure investments.
Use when:
Building a new analytics platform or consolidating workloads around Fabric and Power BI.
Variant 3: Azure End-to-End
Strongest benefit:
Maximum flexibility and control over individual platform services.
Primary compromise:
Higher integration, governance and operational complexity.
Use when:
An established Azure platform, Databricks investment or specialized infrastructure requirement already exists.
Variant 4: Azure and Fabric Hybrid
Strongest benefit:
Preserves Azure foundations while introducing Fabric as a unified analytics and consumption platform.
Primary compromise:
Requires well-defined ownership and governance across two platform environments.
Use when:
Modernizing an existing Azure architecture while expanding analytical capabilities through Fabric.
Why the Hybrid Architecture Is Often the Ideal Target State
For many established organizations, the most pragmatic target architecture is the hybrid Azure and Fabric model.
A complete replacement of a functioning Azure platform is often unnecessary. Azure Data Factory, ADLS Gen2 and Azure SQL may already support numerous operational systems, security requirements and integration processes.
At the same time, keeping the complete analytics lifecycle exclusively in traditional Azure services can create a fragmented landscape. Storage, engineering, transformation, serving, semantic modeling and reporting may require separate services, security configurations and operating models.
The hybrid architecture allows both environments to perform the tasks for which they are best suited.
Azure as the Durable Foundation
Azure remains responsible for:
Enterprise source-system connectivity
Raw and historical storage
Operational staging
Established networking
Existing security integration
Reusable ingestion pipelines
Long-term retention
This protects previous investments and avoids unnecessary disruption.
Fabric as the Analytical Acceleration Layer
Fabric becomes responsible for:
Analytical transformation
Lakehouse and Warehouse modeling
Gold-layer creation
Semantic modeling
Power BI reporting
Data science
Real-time analytics
AI-assisted analysis
Conversational access to governed data
This extends the platform beyond conventional batch reporting.
Zero-Copy Access Where Appropriate
OneLake shortcuts can expose data stored in ADLS Gen2 to Fabric without requiring the entire dataset to be copied into OneLake.
This can:
Reduce duplicate storage
Shorten onboarding time
Lower data-movement overhead
Preserve Azure as the authoritative source
Make data available to Fabric analytical engines through a unified namespace
Physical copies should still be used where independent retention, transformation isolation, performance or regulatory requirements justify them.
Extended Analytical Capabilities
Once governed data is available in Fabric, the organization can extend the solution beyond traditional Power BI reporting.
Potential capabilities include:
Data Engineering
Fabric notebooks and Spark can support scalable transformation, enrichment and feature preparation.
Data Science
Data scientists can use Fabric notebooks and machine-learning workflows close to the governed analytical data.
Real-Time Intelligence
Streaming telemetry, events and operational signals can be ingested, analyzed and acted upon with reduced latency.
For the MagentAI scenario, this could support:
Live monitoring of AI requests
Immediate detection of handover spikes
Real-time service-quality alerts
Operational anomaly detection
Proactive incident escalation
AI Functions
Fabric AI functions can enrich structured datasets with language-model-powered processing.
Potential use cases include:
Classifying conversation topics
Extracting entities
Summarizing customer interactions
Detecting sentiment
Categorizing service requests
Enriching unstructured feedback
Fabric Data Agents
A Fabric data agent can provide conversational access to governed organizational data.
Instead of navigating a fixed dashboard, authorized users could ask questions such as:
Which service experienced the largest increase in AI handovers?
Which customer segments have the lowest satisfaction?
What were the primary reasons for failed retrievals this week?
Which regions show both high incident volume and low CSAT?
Copilot-Assisted Workflows
Copilot experiences can support data engineering, data exploration, DAX creation and report development.
These capabilities can reduce development friction and improve access to analytical insights, subject to licensing, governance and regional requirements.
Graph Analytics
Graph capabilities can help model and analyze complex relationships between:
Customers
Conversations
Services
Incidents
Knowledge articles
AI intents
Handover events
This may reveal patterns that are difficult to identify through conventional relational analysis alone.
Integrated Semantic Modeling and Power BI
Fabric also brings the analytical and reporting layers closer together.
The Gold model, semantic model and Power BI report can be governed within the same broader platform environment.
This improves:
Reuse of business logic
Consistency of KPIs
Collaboration between data engineers and BI developers
Lineage from source to report
Security management
Deployment and lifecycle management
A Gradual Modernization Path
The hybrid model does not require a big-bang migration.
An organization can begin with one domain or use case:
Keep the current Azure ingestion and storage processes.
Connect Fabric to selected Azure datasets.
Build the Silver and Gold layers in Fabric.
Introduce semantic models and Power BI reporting.
Add real-time, data science or AI workloads where they create value.
Review over time which existing Azure transformations should remain and which could move into Fabric.
This reduces implementation risk while creating a clear modernization path.
Recommended Architecture for MagentAI
For an established enterprise environment, the preferred target architecture would therefore be the hybrid Azure and Microsoft Fabric variant.
Azure would provide:
Stable source-system integration
Raw and historical storage
Enterprise networking
Operational staging
Existing security controls
Microsoft Fabric would provide:
Analytical transformation
Silver and Gold modeling
Semantic models
Power BI reporting
Real-Time Intelligence
Data Science
AI functions
Data agents
Additional future analytical experiences
The hybrid model creates a balance between:
Stability and innovation
Existing investment and modernization
Operational control and analytical agility
Durable storage and flexible consumption
It is therefore not simply a compromise between Azure and Fabric. In many environments, it is the architecture that makes the most effective use of both platforms.
Key Takeaways
Analytics Is an End-to-End Process
The value of analytics does not begin in Power BI. It begins with reliable source integration, controlled transformation and governed data modeling.
The Same Business Problem Supports Multiple Architectures
The MagentAI use case can be implemented through:
A practical Fabric demonstration
A complete Fabric platform
A modular Azure platform
A hybrid Azure and Fabric design
Medallion Architecture Creates Clear Responsibilities
Bronze, Silver and Gold layers separate:
Source preservation
Cleaning and standardization
Business modeling
The Semantic Layer Remains Essential
Power BI semantic models centralize:
Relationships
Measures
KPIs
Security
Reusable business definitions
Hybrid Does Not Mean Unnecessarily Duplicating Data
Shortcuts, pipelines and Dataflows should be selected deliberately.
Not every Azure dataset requires another physical Bronze copy in Fabric.
Fabric Extends the Solution Beyond Reporting
Fabric can add:
Data engineering
Real-time analytics
Data science
AI enrichment
Conversational data access
Graph-based analysis
Integrated semantic modeling
Conclusion
The implemented SharePoint-based Fabric demo proves the complete analytical concept: source integration, ingestion, layered transformation, dimensional modeling, semantic modeling and Power BI reporting.
The additional production variants demonstrate how the same concept can evolve according to an organization’s platform strategy.
A Fabric-only architecture provides the most unified experience.
An Azure-only architecture provides extensive control and modularity.
A hybrid architecture preserves Azure as the durable integration and storage foundation while using Fabric to expand the analytical, semantic, real-time and AI capabilities of the solution.
For an organization with existing Azure investments and a strategic focus on Power BI, this hybrid model is often the strongest long-term approach:
Azure provides the enterprise data foundation. Microsoft Fabric turns that foundation into governed, scalable and AI-ready business value.